The latest Scientific American Worldview Scorecard, released at the BIO 2015 International Convention, which ranks the biotechnology innovation potential of 54 countries, finds that the U.S. is the leading country once again based on its performance in seven categories used in the study. This is the 7th edition of the Scorecard that tracks the maturation of the biotechnology industry around the world by analyzing and interpreting data derived from each country's annual development.
To quantify that information, each country's achievement was ranked on a series of individual components using a scale from 0 to 10, with the lowest-ranked nation scored as 0 and the highest-ranked as 10. Scores were assigned for each of the seven major categories – productivity, intellectual property (IP) protection, intensity, enterprise support, education/workforce, foundations, and policy and stability – the last of which was added for the first time in the 2012 survey to explore a government's power to implement laws that impact the development of its biotech industry. Each of those categories, apart from IP, consists of several subcategories. For example, foundations, the scorecard describes, use four components: R&D business expenditures per GDP, government support of R&D per GDP, infrastructure quality and innovation and entrepreneurship opportunity.
A FAMILIAR POSITION
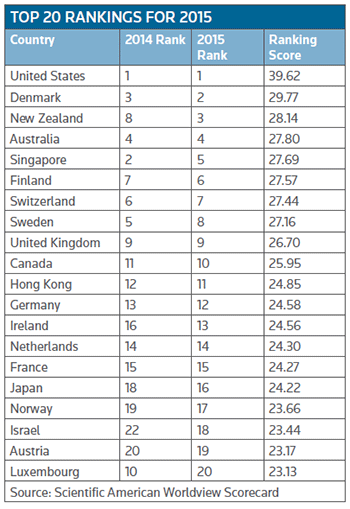
 In terms of final rankings, it came as no surprise that the U.S. maintained its top Worldview spot, a position it has held since the Scorecard was first introduced in 2009. In fact, it increased its lead over its nearest rivals, who for the most part maintained their 2014 rankings. (See Top 20 Rankings for 2015.)
There was not much year-over-year change in the order of the nine countries following the U.S. Denmark improved its 2014 ranking by one to claim the second spot, followed by New Zealand, vaulting up from eighth position. That country's annual ranking, the report observed, has jumped around since 2009, from a high of three this year to a low of 18 in 2010 and 2011, reinforcing the fact that countries cannot rest on their laurels, they need to constantly work on nurturing their biotech industries. New Zealand secured its lofty position this year thanks, in part, to earning high marks in the education/workforce and policy and stability categories.
According to the report, the relatively small differences in ranking scores is a clear indication that changes in a country's performance, both up or down, in any of the categories can have a dramatic effect on their final positioning for the year. Denmark, for example, scored just 13 percent higher than 10th-placed Canada. There was only a 22 percent difference in the overall scores between the second and 20th-place holder, Luxembourg, which dropped out of the 2014 top 10 with a thud this year.
The U.S. ranked first in two categories – productivity and education/workforce – and achieved second place in the intensity and enterprise support categories. Outside those metrics there is still certainly room for improvement; in the policy and stability category, for example, the U.S. continues to place poorly and ranked only 20th.
The Scorecard data for that category come from the World Bank's 2014 World Governance Indicators, which consist of "political stability and absence of violence/terrorism," "government effectiveness," "regulator quality" and "rule of law."
RECOVERY WELL UNDER WAY
The 2015 Scorecard, in tune with a number of analyses on the industry, demonstrate "a clear indication of economic recovery."
"The Scorecard project was started in 2009 when the economic crisis had just hit," Yali Friedman told BioWorld Insight. He has been involved with the Scorecard from the start and heads up the interpretation of the data each year.
"Two years ago we got the first glimpse that things were improving, and last year represented two consecutive periods that market caps were on the rise."
The study uses public company market capitalization in combination with the number of public companies in each country, as a metric for a broad international comparison of the industry.
The U.S. historically has led the world in biotech market capitalization and continues to do so, the data find. What was striking is how much that lead has increased. "What we found a year ago was that the U.S. market capitalization was close to four times that of the non-U.S. global total, and this year it ballooned to nearly six times that total," Friedman explained. Australia had the second largest growth, adding nearly $5 billion in market cap, or roughly the sum of all of Sweden's public biotech companies.
While most of the top ranking countries saw growth in that category, Ireland, however, bucked the trend, exhibiting a two-year drop.
"This raises questions about the country's strategy to offer cash benefits for companies to locate their headquarters there and whether the strategy is working quite as well as they had hoped," Yali noted.
The strong U.S. gains in both the number of public companies and public company market capitalization indicates the likelihood of further growth ahead, the report said.

